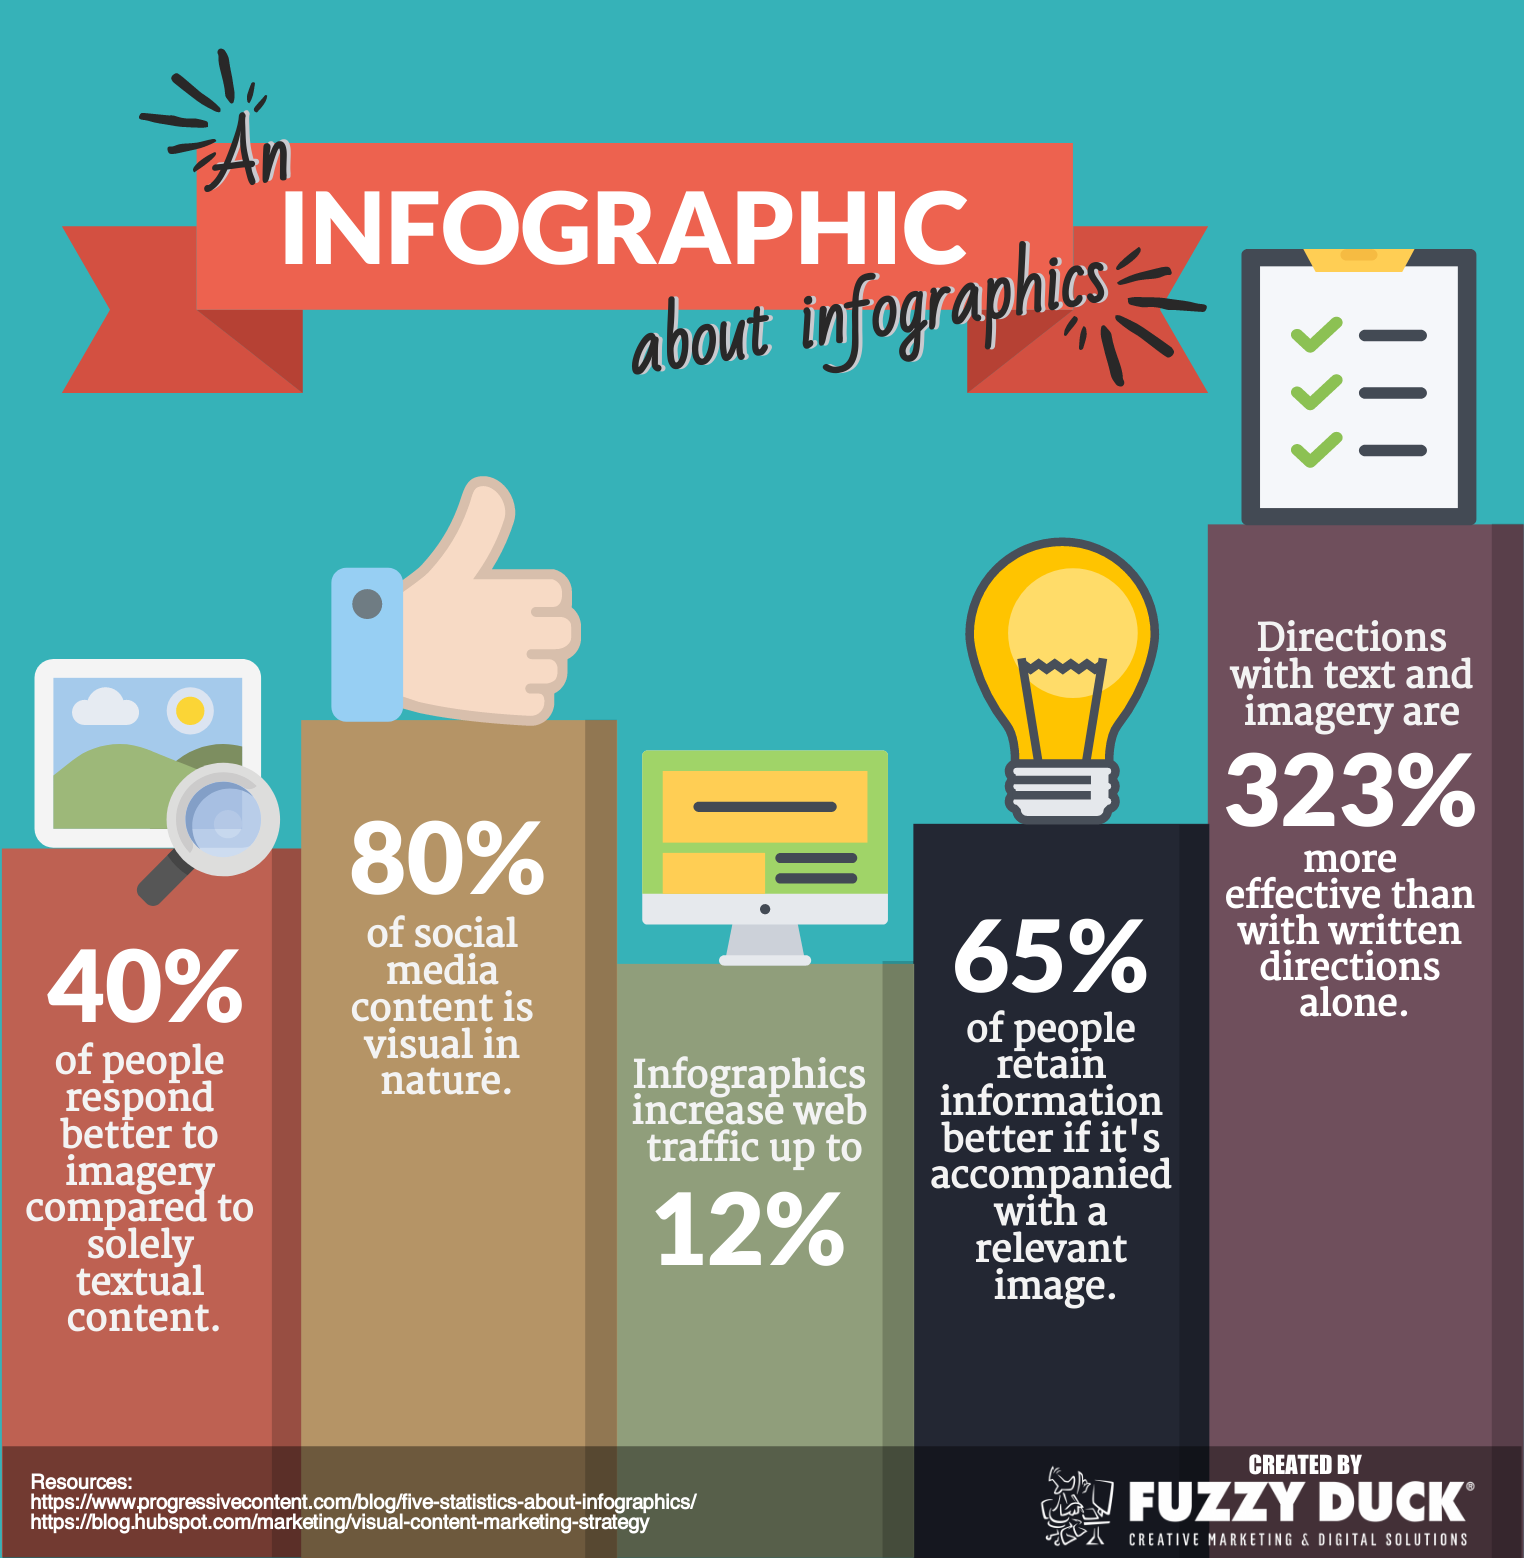
Infographics are a combination of content, graphic design and data. With reducing attention spans and growing need to be visual it is important to grab your audience’s attention quickly and keep them coming back. Infographics are a great tool to deliver data and analysis in an engaging manner providing a far more memorable experience.
Here’s why you really need an infographic to make your marketing efforts reach further;
Attention. Attention – Using the right combination of colours, pictures, data and words, an infographic can grab the consumers attention and give them far more information in a shorter span of time.
Who’s the expert – Using a good amount of charts, graphs and statistics in the infographic you can demonstrate your expert knowledge of a given topic and thus build your credibility. This goes a long way in establishing you as an expert in the subject and will get your audience coming back for more.
Simplify information – Complex information and in depth data research can be demonstrated in a simpler way via an infographic. Also a fairly large amount of data and information can be crunched into smaller more visual formats, making it easy to consume and also remember. It is believed that about 99% of all sensory information is filtered out by the brain almost immediately, that means only 1% of the information actually goes through the brain – and infographic is in this 1%.
Brand boost – Infographics that include your brand colours, company logo and follow brand guidelines enable brand recall when shared across multiple channels. When you include your company website and contact information on these infographics they are bound to prompt enquiries pertaining to the information represented in the infographic. A human brain can recognise a familiar object/logo/pattern in less than 100 milliseconds and infographics help familiarise your brand for your audience.
Build SEO – Sharing infographics on social media channels with links back the website is a great way to build backlinks that help SEO. Though infographics are just images there are ways in which they can contribute towards your SEO. Using the right keywords in the file name, in the ‘alternative text’ and meta description goes a long way in building SEO. Similarly using the right keywords in the supporting text just before the infographic helps optimisation. Check this article on how to optimise your infographic for SEO.
Here’s one from Fuzzy Duck on the importance of infographics; 
Do check out some stellar infographics via @marketing_masha on Twitter for some inspiration and the right use of data and information to create beautiful pieces of visual content.
Some amazing yet easy to use tools to create infographics are Canva, Piktochart, Visual.ly and many more. Most have a free basic sign-up account to get started. As you get creating remember to be original, be authentic, mention sources and give credits where ever necessary.
Happy infographing!

